In my last entry I compared the frequencies of my two 10 MHz frequency references. One is from FEI FE-5680A Rubidium Frequency Standard (RFS) and the other one is from Trimble Thunderbolt GPS Disciplined Oscillator (GPSDO).
The frequency accuracy of RFS drifts over time. The manufacturer specifies drift of less than 2×10⁻⁹ per year, which for 10 MHz reference is 0.02 Hz . I don’t understand the drift mechanism, but in any case the frequency offset of this RFS needs to be measured and corrected. (Why? because I could.)
The frequency accuracy of GPSDO, on the other hand, does not drift with time. This is because the guys at the U.S. Naval Observatory (USNO) continuously monitor and correct the clocks in their GPS satellites to track UTC(USNO). The UTC(USNO) in turns tracks the Coordinated Universal Time (UTC) time maintained by BIPM in Paris.
In my last entry, the way I compared the two frequencies was by comparing the phase of the two waveforms on an oscilloscope. In that short time comparison, the two frequencies were virtually identical. The two waveforms were virtually stationary with respect to each other. In order to measure the difference between these two nearly identical frequencies, I need to track the phase difference over a much longer period of time. Here is the block diagram of the circuit that helps me do this:
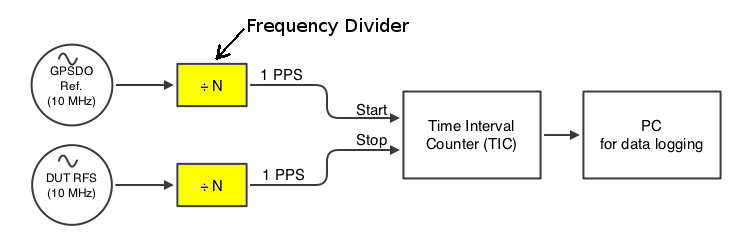
For convenience, both 10 MHz references were first converted to 1 pulse-per-second (PPS) signals. One PPS drives the “start” signal of a Time Interval Counter (TIC) and the other PPS drives the “stop” signal of the same TIC. The TIC measures the time interval between the “start” and the “stop” signal. The TIC is build using a digital counter clocked at 50 MHz which gives 20 ns resolution. The interval values were then sent to a PC for data-logging. And here is the result:

The top graph shows the time interval measured. The horizontal axis is the elapsed time. Each sample point correspond to 1 second. Over a period of 8.3 hours, the PPS signal of the RFS drifted by 320 ns. This drift corresponds to an error of 1.1×10⁻¹¹ or 0.00011 Hz.
The bottom graph plots the self-monitoring performance of the GPSDO. It shows that the GPSDO is functioning correctly during the duration of the experiment.
The frequency error of 0.00011 Hz is pretty impressive. This RFS was calibrated about a month ago. This hasn’t always been the case. When I first acquire the RFS, its frequency error was 0.072 Hz. It wasn’t bad, it was good, but it is impressive now 🙂
Next: improve the resolution of my counter. Short of buying Stanford Research SR620 counter, I’m planning to add a linear interpolator to my digital counter. Basically it will use the rise time of an RC circuit to measure time in-between the counter oscillator “ticks”.
Next: Understand time stablitity measurement, also known as Allan Deviation.
If I read the Thunderbolt’s specs correctly, the frequency stability (measured over 1 second) is 1.4 x 10^-11 so that’s about the same drift asthe 1.1E-11 you concluded as RFS drift. This makes me wonder if you did not just measure the GPSDO drift instead. As I understood the RFS delivers a very stable output that drifts but always in one direction whereas the GPSDO lacks stability but is being corrected to make sure it does not drift.
Another thing is of course the drift of you 50 MHz oscillator. You are determining the difference between GPSDO and the RFS using a 50 MHz crystal based oscillator so in your measurements you also will see the drift of the 50 MHz oscillator. You should also measure the accuracy and drift of the crystal oscillator, using the GPSDO to start and stop the TIC (maybe you did?)
The accuracy of the RFS is still flabbergasting: used as a source for a clock it would only drift about 1 second every 16 years 🙂
Thanks for the questions Rob.
The 50 MHz oscillator is used for measuring short time interval of approximately 20,000 ns (1016*20ns) with a resolution of 20 ns. It does not need high accuracy/stability. The 20 ppm oscillator uncertainty corresponds to 0.4 ns uncertainty (for the 20,000ns measurement interval). This is much smaller than the measurement resolution of 20 ns. The time interval measurement is spot on (within the 20 ns resolution).
The 1.4^-11 figure you looked at is the Allan deviation figure. The PPS accuracy of the GPSDO is 15 ns. This means that any given time, the clock output of the GPSDO is accurate to within 15 ns of UTC. Over the 8.3 hours of the experiment, the clock of the RFS changed by 320 ns when compared to the GPSDO. This 320 ns drift is much longer than the 15 ns possible error due to the GPSDO. This is why I attribute this 320 ns of error to the RFS drfit.